
Detector Loop Map in Ingolstadt
As a contribution to the SAVeNoW research project, the city of Ingolstadt provides vehicle count loop data from the entire city area for the period 2019 to the present. Data is available in 15-minute time steps for more than 700 counting loops.
For the efficient management and interactive visualization of the data for the project partners, the Chair of Geoinformatics (TUM) in cooperation with e:fs has put together an open source IoT application stack. The stack is hosted in a Kubernetes cluster based on Microsoft Azure cloud services. It consists of several IoT services for providing standardized API access to the data, an overview map for the location of detectors, as well as data visualization and data integration tools.
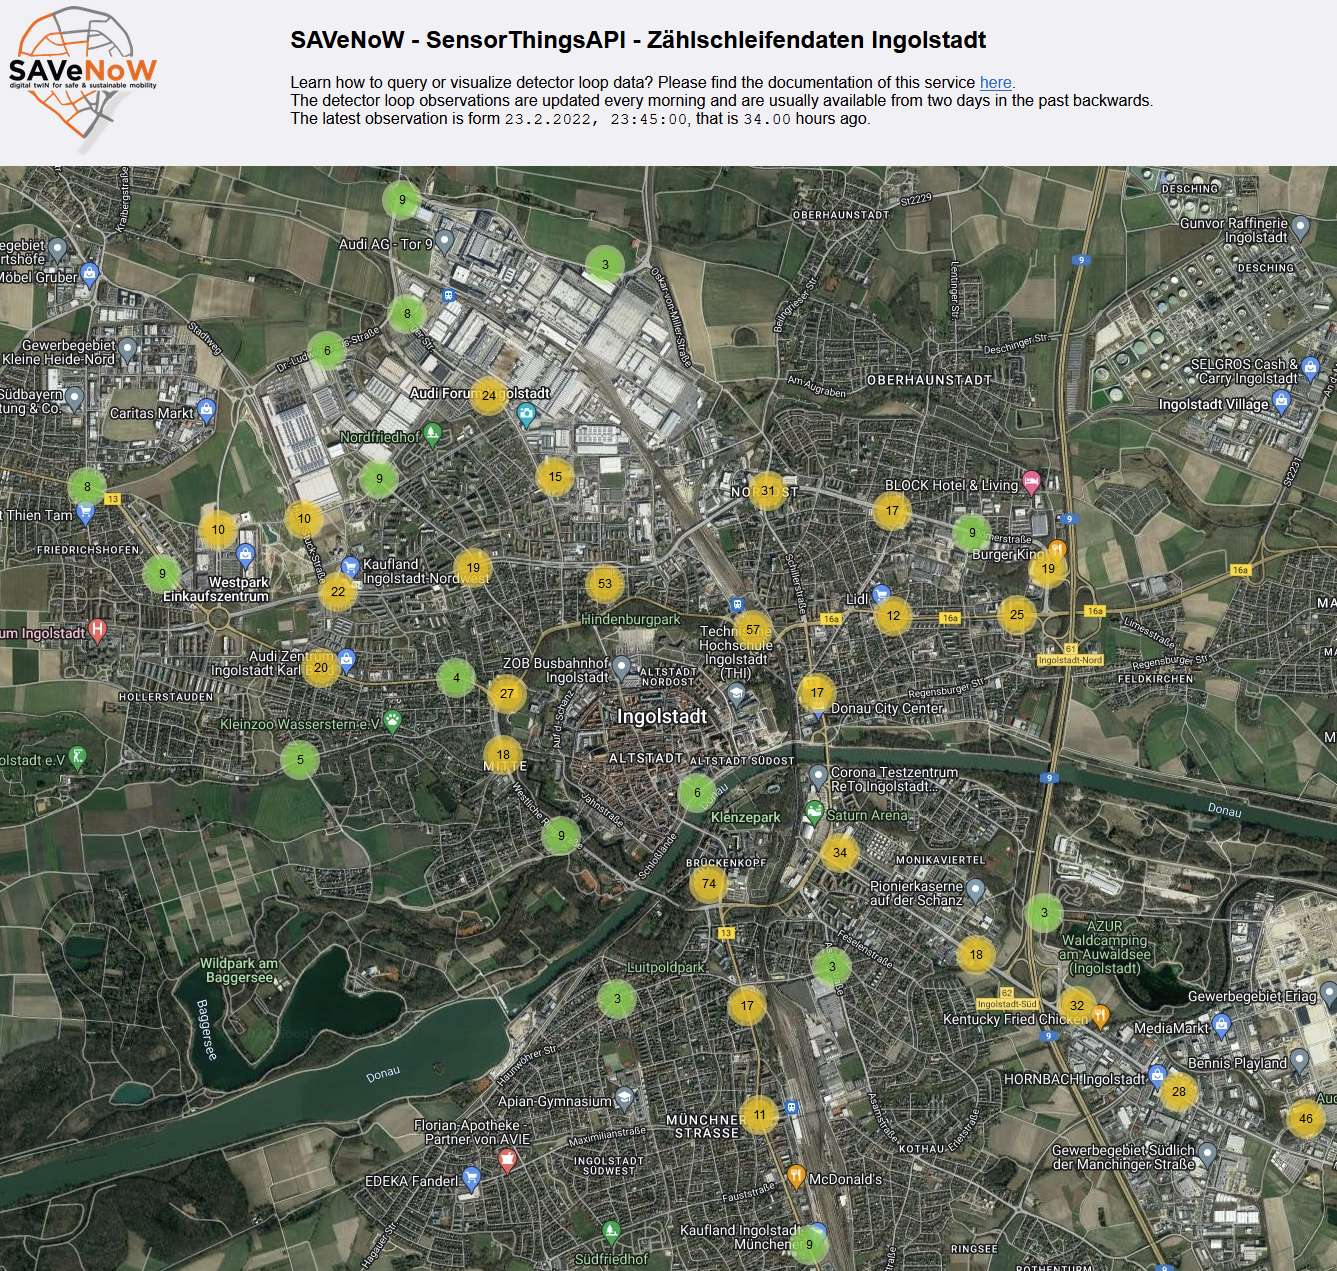
Over 700 traffic detectors in the form of induction loops are installed in the city of Ingolstadt, which transmit the number of passing vehicles every 15 minutes. The data has been available since 2009 and is updated daily. All loop detectors are located on the map. Clicking on a marker opens a popup with the traffic volume in real time.
Daten und Ressourcen
-
Detector Loop Maphtml
Link to the Detector Loop Map
-
Documentation for project partnershtml
SensorThingsAPI Documentation in Confluence Audi Tool Username and Password...
-
Dokumentation TUMhtml
Dokumentation for Managing detector loop data from Ingolstadt using open...
Dieser Katalogeintrag ist explizit mit anderen verbunden. Um weitere Informationen zu erhalten, gehen Sie bitte auf "Verknüpfungen" (auf den Link oder auf Register "Verknüpfungen" oberhalb der Überschrift des Katalogeintrages klicken).
Zusätzliche Informationen
| Feld | Wert |
|---|---|
| Autor |
|
| Verantwortlicher |
|
| Sprache | |
| Version | |
| Start des Gültigkeitszeitraumes | |
| Ende des Gültigkeitszeitraumes | |
| Räumliche Ausdehnung |
Räumliche AusdehnungMap data © OpenStreetMap contributors
Tiles by Stamen Design (CC BY 3.0)
|
| spatial | {"type":"MultiPolygon","coordinates":[[[[11.368349,48.726982],[11.368349,48.803472],[11.503017,48.803472],[11.503017,48.726982],[11.368349,48.726982]]]]} |
| Benutzerdefiniertes Feld |