
Grafana Dashboard for Detector Loop
Messung des Verkehrsaufkommens durch Zählschleifen
An einem Großteil der Ampeln im Stadtgebiet von Ingolstadt sind Zählschleifen in die Fahrbahn eingelassen, die darüberfahende Fahrzeuge erkennen und zählen. Die Daten werden in nahezu Echtzeit auf einem zentralen Rechner der Stadt abgelegt. Diese werden vom Forschrungsprojekt SAVeNoW abgerufen, verarbeitet und in eine performante, standardisierten Sensordatenbank übertragen. Zur Anwendung kommen die Verkehrszählungen zur Verbesserung der Genauigkeit der Verkehrssimulation. Mittels minutengenauen Daten über das Verkehrsaufkommens an den einzelnen Kreuzungen, kann ein akuraltes Abbild des Realverkehrs innerhalb der Simulation geschaffen werden. Somit bilden Verkehrsdaten das Fundament für eine realistische Simulation. Mithilfe der Konzepte und Ideen zur Verbesserung des Verkehrs in Ingolstadt unkompliziert getestet und validiert werden können.
Im Dashboard ist es möglich, verschiedene Analysen und Dashboards zu sehen, die aus den Messungen der Sensoren resultieren.
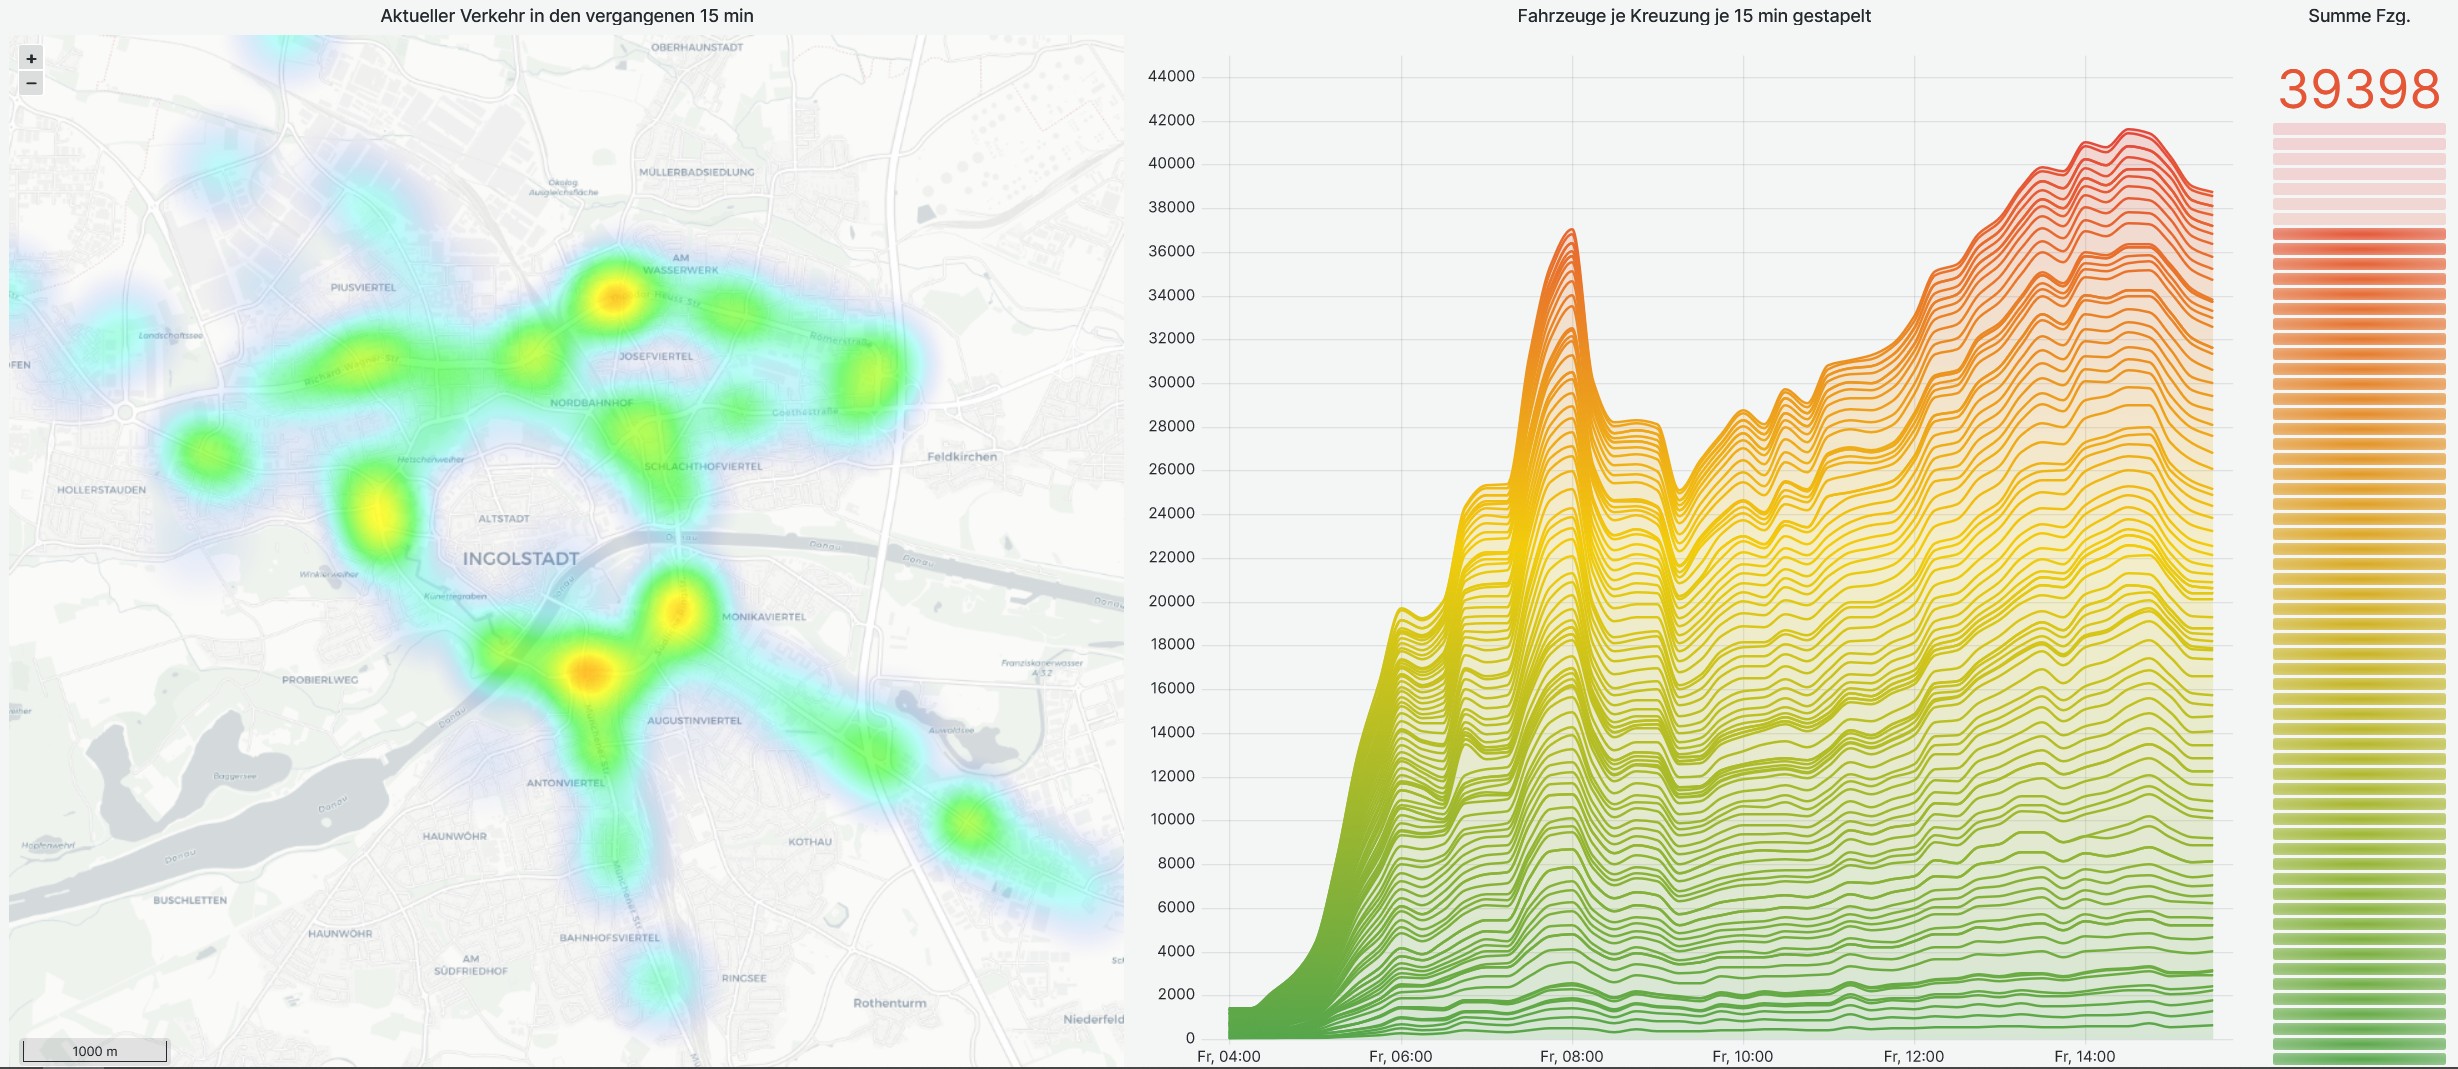 Abbildung 1: Vorschau Dashboard zur Verkehrsstärke in Ingolstadt.
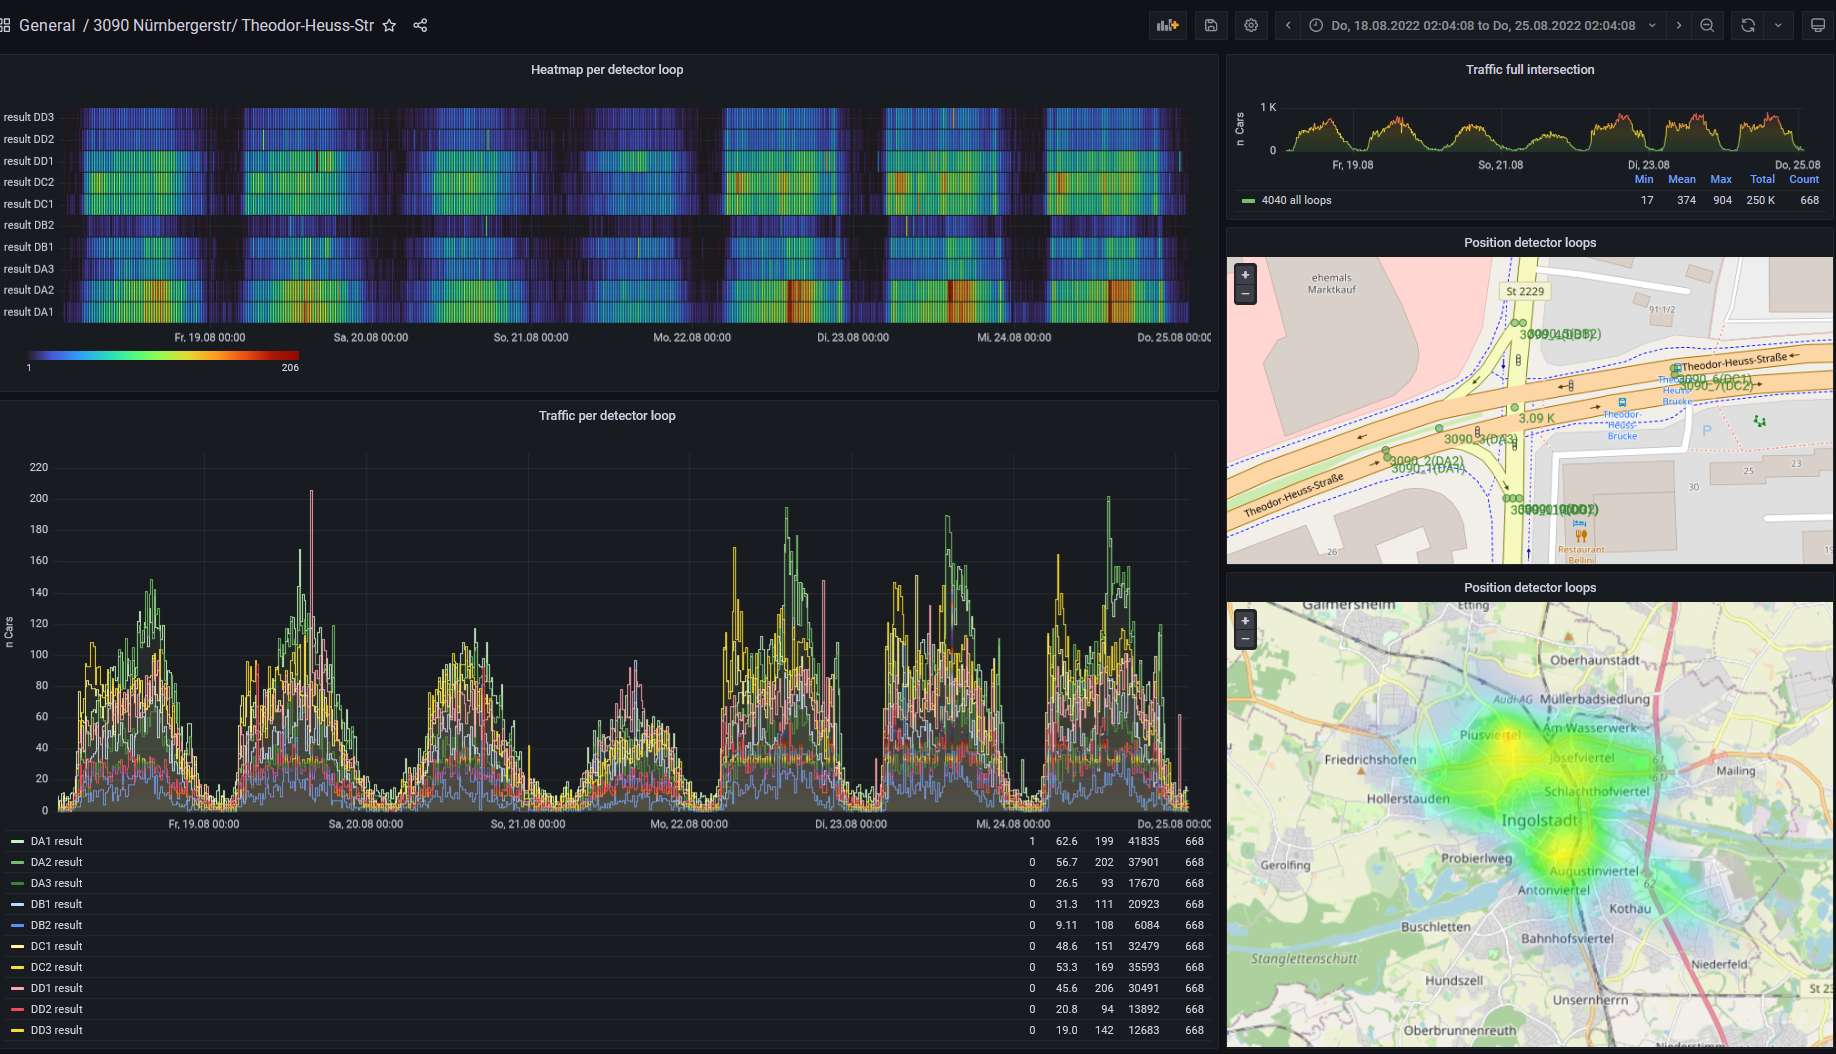 Abbildung 2: Vorschau Dashboard zur Verkehrsstärke an der Kreuzung Nürnberger-/Theodor-Heuss-Straße
Dada i recursos
-
ShowRoom Dashboardshtml
Auf dem Dashboard ist es möglich, dieMessung des Verkehrsaufkommens durch...
This catalog entry is linked to others. To see all relationships please click here or click on the tab "Relationships" at top of this page.
Informació addicional
| Camp | Valor |
|---|---|
| Autor |
|
| Mantenidor |
|
| Idioma | Deutsch |
| Versió | |
| Start des Gültigkeitszeitraumes | |
| Ende des Gültigkeitszeitraumes | |
| Räumliche Ausdehnung |
Dataset extentMap data © OpenStreetMap contributors
Tiles by Stamen Design (CC BY 3.0)
|
| spatial | {"type":"MultiPolygon","coordinates":[[[[11.368307,48.733833],[11.368307,48.797649],[11.500919,48.797649],[11.500919,48.733833],[11.368307,48.733833]]]]} |
| Benutzerdefiniertes Feld |