
SAVeNoW - Story Map
The storytelling map integrates various data produced in the SAVeNoW project with the aim of demonstrating different scenarios and showing different project products.
In the Storymaping tool, it is possible to see a number of different applications, used data (pointcloud, OpenDrive Models, High-resolution models in FBX format), simulations (Raw data acquisition for traffic simulation, SUMO traffic simulation, A2D2 test drive in the LOD3 area) and video demonstrations from different project partners.
 Figure 1: View of the storymaping tool in which the combinations of different data types are displayed
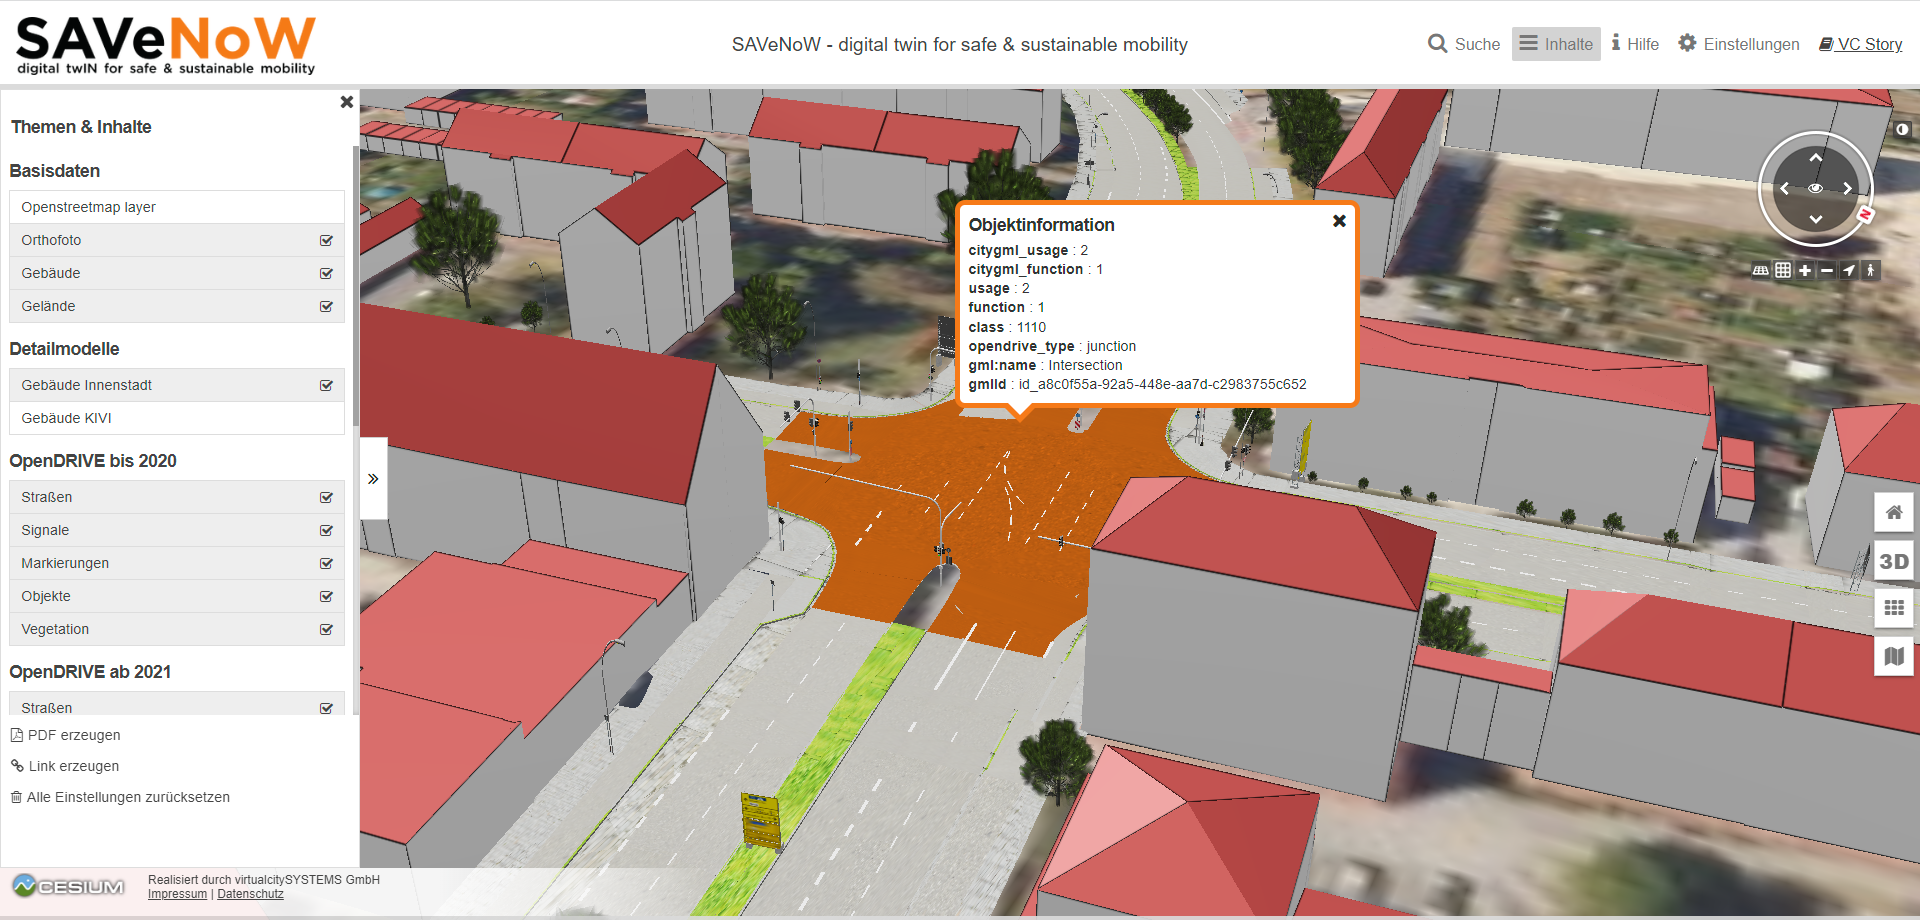 Figure 2: Map view in which an object has been selected and the saved metadata are displayed
Данни и ресурси
-
SAVeNoW Story map for guided explorationhtml
Link to the Story Map online application. It is publicly accessible.
-
Map web application for interactive...html
To view the map, you need proper access credentials. To obtain the password...
Допълнителна информация
| Поле | Стойност |
|---|---|
| Автор |
|
| Отговорник по поддръжка |
|
| Език | Deutsch |
| Версия | |
| Start des Gültigkeitszeitraumes | |
| Ende des Gültigkeitszeitraumes | |
| Räumliche Ausdehnung |
Dataset extentMap data © OpenStreetMap contributors
Tiles by Stamen Design (CC BY 3.0)
|
| spatial | {"type":"MultiPolygon","coordinates":[[[[11.352091,48.707587],[11.352091,48.795415],[11.552515,48.795415],[11.552515,48.707587],[11.352091,48.707587]]]]} |
| Benutzerdefiniertes Feld |